
The Lower-Middle-Market Business Valuation Blueprint: SDE vs. EBITDA Multiples, DCF Modeling, and 2026 Industry Benchmarks
A multi-methodology appraisal guide for founders, private equity deal teams, and strategic buyers valuing privately held companies from $1M to $50M in enterprise value.
1. The Lower-Middle-Market Valuation Landscape
The lower middle market represents privately held enterprises generating between $1M and $50M in enterprise value, where valuation methodology transitions from personal discretionary income to institutional EBITDA.
Valuing companies in this segment is fundamentally different from both Main Street small businesses (under $2M in revenue) and large corporate M&A. Institutional buyers—including private equity platforms, independent sponsors, and corporate strategics—price companies based on post-close cash flow predictability rather than past founder tax deductions.
In 2026, capital market dynamics, higher benchmark interest rates, and institutional focus on Quality of Earnings (QofE) have widened the multiple spread between "average" companies and "platform-ready" operations. Clean accounting, documented SOPs, and recurring revenue contracts command historic premiums, while owner-dependent businesses experience severe re-trading during due diligence.
2. SDE vs. Adjusted EBITDA: The $1M Cash Flow Inflection Point
Seller's Discretionary Earnings (SDE) measures total financial benefit generated for a single full-time owner-operator, whereas Adjusted EBITDA isolates pure enterprise profitability after paying fair-market executive management salaries.
Founders frequently conflate SDE with EBITDA, leading to severe valuation discrepancies when entering market. The transition occurs at approximately $1M in annual earnings and $5M in enterprise value:
Under $1M Cash Flow (SDE Multiples)
Typically valued between 2.0x and 3.5x SDE. The buyer is buying a job and direct operator income. Officer compensation is added back 100% into the earnings base.
Over $1M Cash Flow (EBITDA Multiples)
Typically valued between 4.0x and 9.0x+ Adjusted EBITDA. The buyer is investing in enterprise cash flow. Founder salary is replaced with a fair-market replacement executive cost ($180k–$300k+), and the remaining EBITDA is capitalized.
3. The Tri-Part Valuation Methodology Hierarchy
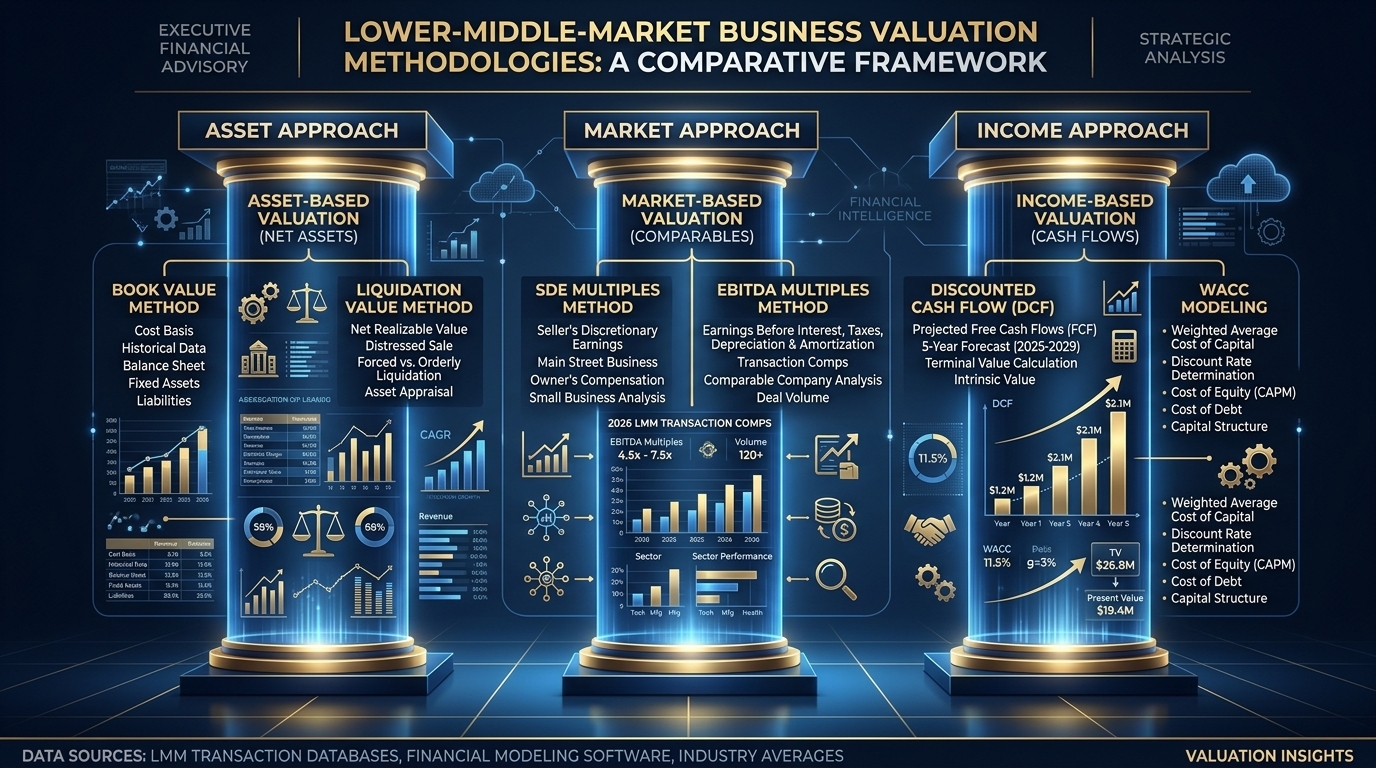
Professional lower-middle-market valuations synthesize three primary methodologies: the Market Comparable Multiple approach, the Income Approach (DCF), and the Asset-Based Approach.
Institutional acquirers and certified appraisers evaluate all three approaches, weighting them according to sector characteristics:
- Market Approach (Comparable Transactions): Analyzes closed M&A transactions of similarly sized companies within the exact NAICS/SIC sector. Provides the baseline market clearing multiple range.
- Income Approach (Discounted Cash Flow / DCF): Projects 5-year unlevered free cash flows discounted back to present value using the Weighted Average Cost of Capital (WACC), typically 14% to 22% for lower-middle-market companies reflecting small firm risk premiums.
- Asset-Based Approach (Adjusted Net Asset Value): Establishes a floor valuation by appraising fair market value of real estate, machinery, equipment, and net working capital. Crucial for asset-intensive industrial manufacturing, heavy construction, and warehousing.
4. 2026 Sector Multiple Benchmarks (101-Sector Empirical Dataset)
| Industry Sector | SDE Multiple ($1M–$5M EV) | EBITDA Multiple ($5M–$50M EV) | Key Multiple Expansion Driver | Audit Tier |
|---|---|---|---|---|
| Commercial HVAC & Facility Services | 2.8x – 3.8x SDE | 4.5x – 8.5x EBITDA | >60% Preventive Maintenance Contracts | High Premium |
| Precision & Industrial Manufacturing | 2.5x – 3.5x SDE | 4.5x – 7.2x EBITDA | Proprietary Tooling & ISO/AS9100 Certifications | Stable |
| Specialty Medical & Healthcare Practices | 3.0x – 4.2x SDE | 5.5x – 9.0x EBITDA | Multi-provider staff, commercial payor mix | High Premium |
| B2B Logistics & Wholesale Distribution | 2.2x – 3.2x SDE | 4.0x – 6.5x EBITDA | Exclusive distribution agreements, EDI automation | Stable |
| Managed IT Services & Cybersecurity (MSP) | 3.2x – 4.5x SDE | 6.0x – 11.5x EBITDA | 3-year recurring MRR/ARR contracts, low churn (<4%) | Platform Target |
| Commercial Electrical & Trades | 2.5x – 3.4x SDE | 4.0x – 6.8x EBITDA | Master service agreements, bonded capacity | Stable |
Private Equity & M&A Valuation Takeaway
In an acquisition priced at 6.0x EBITDA on $3M in target cash flow ($18M EV), identifying a 5% margin expansion ($150,000 incremental EBITDA) and lifting the exit multiple by +1.0x (to 7.0x) yields an incremental $4.05M in enterprise value creation at exit.
5. Working Capital Pegs & Cash-Free, Debt-Free Deal Mechanics
A lower-middle-market business sale is almost universally negotiated on a "cash-free, debt-free" basis requiring the delivery of a normalized Net Working Capital (NWC) target at closing.
One of the most frequent post-LOI value traps occurs during working capital negotiations. The buyer purchases the enterprise's operating earnings, which requires adequate operating assets to generate. The NWC Peg represents a 12-month trailing average of current assets (AR, inventory, prepaid expenses) minus current operating liabilities (AP, accrued wages, sales tax payable), excluding cash and interest-bearing debt.
If actual working capital delivered at close is $300,000 above the agreed Peg, the seller receives an additional $300,000 cash at closing. If it is $300,000 below the Peg, purchase price is reduced dollar-for-dollar. Establishing a defensible working capital peg early during CIM preparation eliminates late-stage deal concessions.
6. Size Premiums & Transferability Risk Adjustments
Enterprise value scales non-linearly with EBITDA size due to lower perceived cost of capital, deeper management structures, and broader buyer liquidity.
Size Premium Scale
A company generating $1.5M EBITDA trades at 4.5x ($6.75M EV), whereas the identical business generating $6M EBITDA commands 7.5x ($45.0M EV). Larger EBITDA bases attract institutional PE platform buyers with lower cost of capital.
Customer Concentration Risk
Any customer accounting for over 15% of gross revenue triggers multiple compression (-0.75x to -1.5x) or mandates seller earnouts, customer tenure certifications, and multi-year master service agreements.
Founder Dependency (Key Person)
If the owner handles primary sales relationships or operational dispatch, buyers discount the purchase price or demand substantial rollover equity and 2-year earnout structures to protect continuity.
Supplier Exclusivity
Single-source vendor relationships without transferable distribution agreements create uninsurable supply chain risks that private equity committees penalize during confirmatory diligence.